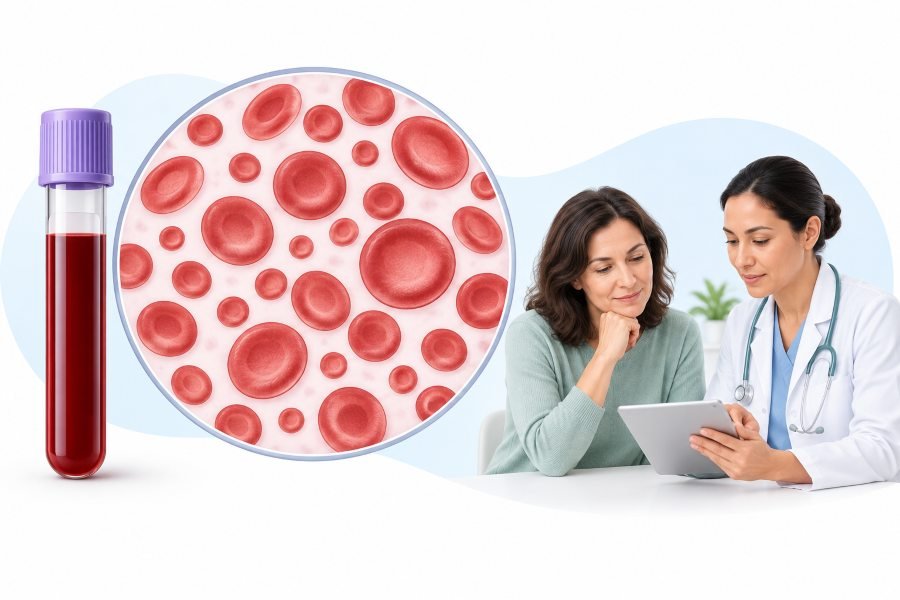
RDW stands for red cell distribution width, and it answers a question none of the other blood count numbers ask. Haemoglobin tells you how much oxygen-carrying protein you have. MCV tells you the average size of your red cells. RDW tells you how much those cells differ from one another. A high RDW means your bone marrow is turning out a mixed batch, some cells noticeably bigger or smaller than the rest, and that mixture is often the first visible sign that something changed recently.
The working facts before anything else:
RDW comes automatically with a complete blood count, so you did not have a separate test for it
It appears in two forms, a percentage called RDW-CV and a femtolitre figure called RDW-SD
Most labs treat RDW-CV of roughly 11.5 to 14.5 percent as normal, though the exact range depends on the analyser
A high RDW means uneven cell sizes, not necessarily disease
A low RDW is not a recognised problem and needs no action
RDW is nearly useless read alone, and genuinely useful read next to MCV
What RDW Actually Measures
What RDW Actually Measures
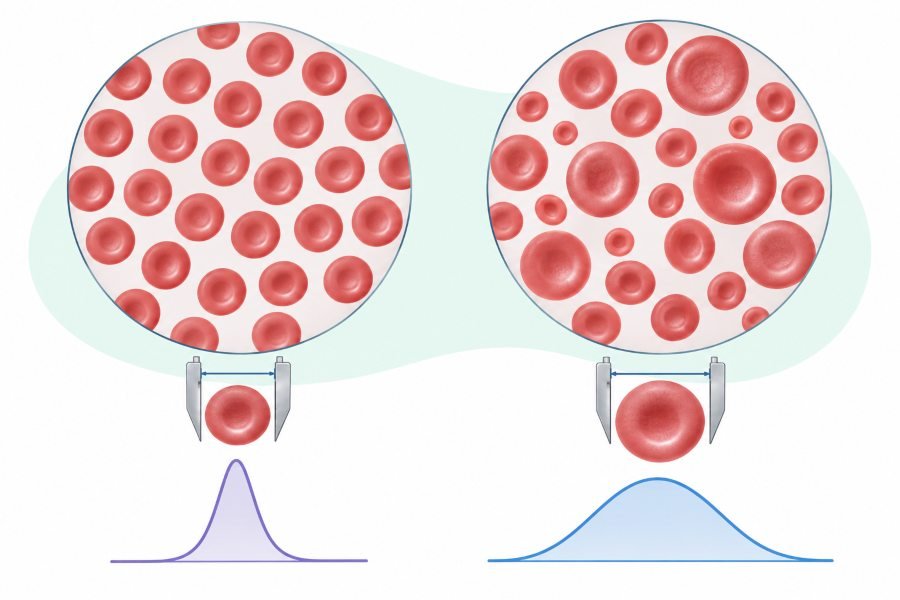
When an analyser sizes every red cell passing through it, the results form a curve. Most cells cluster near the average, and the width of that cluster is what RDW reports. Narrow curve, uniform cells, low RDW. Wide curve, mixed population, high RDW. Pathologists call this variation anisocytosis, and before machines existed they estimated it by eye on a stained slide. The Medscape reference on the RDW test makes the point that when RDW comes back raised, a blood film should show obvious size variation, which is a useful cross-check when a number looks odd.
The company it keeps on the report:
Haemoglobin, the headline number for whether anaemia is present
MCV, the average cell size, which RDW must be read alongside
MCH and MCHC, how much haemoglobin the cells carry
Reticulocyte count, how many brand new cells are entering circulation
Platelets and white cells, which matter when the marrow itself is involved
The Two Versions Of RDW And Why They Differ
Your printout will carry one of these, sometimes both, and they are not interchangeable. RDW-SD measures the actual width of the size distribution in femtolitres. RDW-CV expresses that spread as a percentage of your average cell size, which means it is influenced by MCV as well as by true variation.
Form
Units
Typical adult guide
What it reflects
RDW-CV
Percent
About 11.5 to 14.5
Spread relative to average cell size
RDW-SD
Femtolitres
About 39 to 46
Absolute width of the distribution
Reference intervals move with the analyser and the population studied, and recent work suggests the upper limits in current use may be slightly lower than older published standards, with women often sitting a little lower than men. This is another reason to compare your result to the range printed beside it rather than to a figure from a forum.
Why RDW Only Makes Sense Next To MCV
Why RDW Only Makes Sense Next To MCV
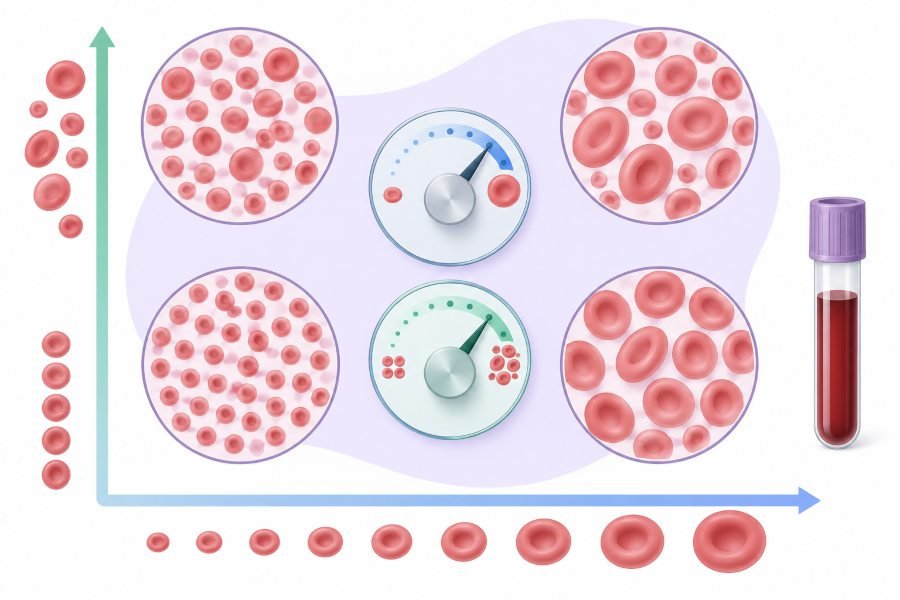
This pairing is the whole point of the number, and it dates back to a 1983 paper by Bessman and colleagues that proposed classifying anaemias by size and heterogeneity together rather than size alone. The grid below is the version still taught today.
MCV
RDW
What it tends to suggest
Low
High
Iron deficiency
Low
Normal
Thalassaemia trait, some anaemia of chronic disease
Normal
High
Early or mixed deficiency, marrow recovery, dimorphic picture
Normal
Normal
Anaemia of chronic disease, kidney disease, acute blood loss
High
High
B12 or folate deficiency, myelodysplasia, haemolysis with a young cell response
High
Normal
Alcohol, liver disease, some medications
The single most useful row is the first pair. Iron deficiency and thalassaemia trait both shrink red cells, and telling them apart matters enormously, since one is treated with iron and the other is made worse by unnecessary iron. In iron deficiency the marrow is running out of supply gradually, so newer cells are smaller than older ones and RDW climbs. In thalassaemia trait every cell has been small since birth, so the population is uniformly small and RDW often stays normal. It is a strong pattern rather than a rule, and confirmation still comes from ferritin and haemoglobin analysis.
Why RDW Often Moves Before Anything Else Does
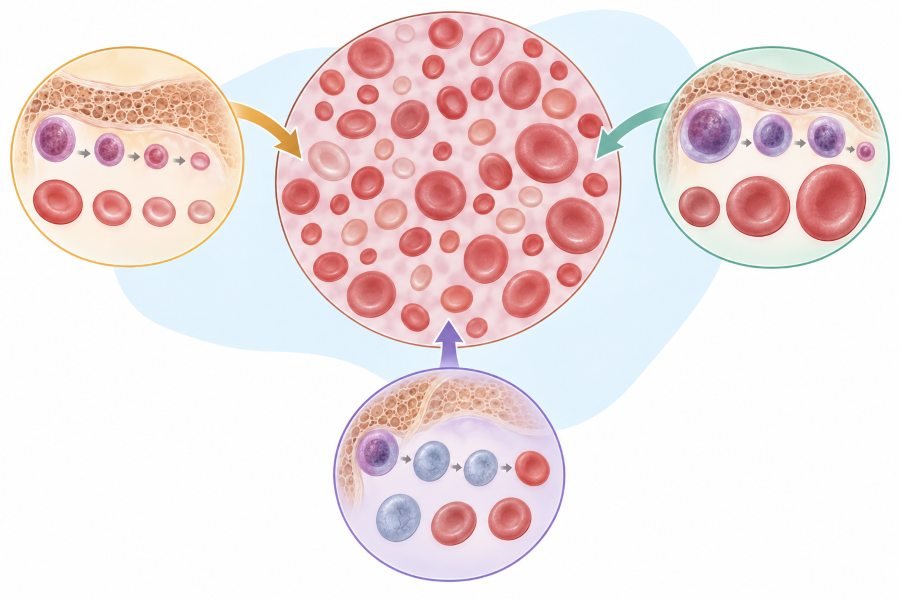
Here is the part that makes this number quietly valuable. Red cells live about four months, so at any moment your circulation holds cells made across that whole window. When supply of iron, B12 or folate starts to fail, only the newest cells are affected. The average barely shifts because old normal cells still dominate, and haemoglobin can stay perfectly normal. What does shift is the spread.
RDW can rise while haemoglobin, MCV and MCH all sit inside their ranges
A raised RDW with a normal count is common and usually points to early nutritional deficiency rather than anything sinister
The same logic applies in reverse during treatment, since a fresh population of normal cells alongside old small ones widens the spread before it narrows
An RDW that goes up a few weeks after starting iron is often a sign the treatment is working, not failing
A recent transfusion produces the same effect, because donor cells and your own cells differ in size
If you are being investigated for tiredness, this is the number worth asking about alongside ferritin. The American Family Physician review on evaluating microcytosis puts ferritin first in the sequence for small cells, and notes that iron deficiency in an adult is presumed to come from blood loss, most often from the gastrointestinal tract, which is why finding low iron usually leads to a conversation about where it went.
What Pushes RDW Up
What Pushes RDW Up
The causes fall into a few groups, and most are ordinary.
Cause
Why the spread widens
What usually confirms it
Iron deficiency
New cells smaller than old ones
Ferritin, transferrin saturation
B12 or folate deficiency
New cells larger than old ones
B12, folate, blood film
Mixed deficiency
Two populations at once
Ferritin plus B12 and folate
Recent bleeding
Young replacement cells enter fast
Reticulocyte count
Haemolysis
Cells destroyed early, marrow compensates
Reticulocytes, bilirubin, LDH
Recent transfusion
Donor and native cells differ
Transfusion history
Liver disease or alcohol
Membrane changes and marrow effects
Liver tests, history
Chronic inflammation
Iron handling and cell survival altered
Inflammatory markers
Myelodysplastic syndrome
Disordered production
Age, other cell lines, marrow assessment
Vitamin B12 needs its own note because of what happens when it is missed. The NHS information on vitamin B12 or folate deficiency anaemia points out that although many symptoms improve with treatment, some nervous system problems can be permanent if the deficiency goes untreated, which is why numbness, tingling, unsteadiness or memory change alongside an abnormal count should be mentioned early rather than saved for the next appointment.
Iron deserves a caution of the opposite kind. Someone with thalassaemia trait or anaemia of chronic disease gains nothing from iron tablets and accumulates iron they cannot easily lose. The NIH iron fact sheet for health professionals sets out why supplementation belongs after confirmed deficiency, not before it.
The Quirk That Makes RDW-CV Look Worse In Small Cells
This is rarely explained to patients and it resolves a lot of confusion. RDW-CV is calculated by taking the spread of cell sizes and dividing it by the average cell size. If your cells are small, the denominator in that sum is smaller, so the percentage rises even when the actual variation has not changed at all.
A markedly low MCV can inflate RDW-CV without any genuine increase in variation
RDW-SD, being an absolute measurement, does not behave this way
Where both are reported, RDW-SD is the cleaner read in someone with very small or very large cells
This is one reason a borderline RDW-CV in a person with microcytosis rarely changes the plan on its own
None of this makes RDW-CV useless. It simply means the number carries an asterisk in exactly the situations where people tend to scrutinise it hardest.
Low RDW Is The Result Nobody Needs To Worry About
Low RDW Is The Result Nobody Needs To Worry About
Plenty of people arrive at this topic because their RDW came back flagged low, and the reassuring answer is that there is no recognised disease of overly uniform red cells. A low RDW means your marrow is producing a consistent product. It is not a deficiency, it is not a warning sign, and it does not require follow-up on its own. If a low RDW appears alongside an abnormal haemoglobin or MCV, the attention belongs on those numbers rather than on the RDW.
What The Research On RDW And Long-Term Health Really Says
These are population associations across tens of thousands of people, not predictions about any individual
RDW is not used as a screening test for heart disease or cancer anywhere in routine practice
The leading explanation is that RDW acts as a rough marker of chronic inflammation and nutritional state, both of which independently affect health
Association is not causation, and nothing suggests lowering RDW for its own sake improves anything
The practical value sits with clinicians assessing people who are already unwell, not with healthy people watching a number
RDW also rises naturally with age, which accounts for part of what these studies observe
The sensible reading is that a persistently raised RDW is worth explaining rather than ignoring, because the explanation is usually something treatable like iron or B12 deficiency, and occasionally something that needs attention. It is not a reason to lose sleep over a single flagged result.
Results That Are Wrong Rather Than Abnormal
Analysers measure what is in the tube, and several things make the tube misrepresent your body. A repeat sample settles most of them.
Cold-reacting antibodies causing red cells to clump, which the machine may size as single large cells
Very high white cell counts interfering with the measurement
Fragments of damaged cells after a difficult blood draw
Recent transfusion, which is a real effect rather than an error but explains the result completely
What A Sensible Follow-Up Looks Like
What A Sensible Follow-Up Looks Like
An abnormal RDW on its own rarely triggers a large investigation. What it does is shape which test comes next. The MedlinePlus page on red blood cell indices covers what these values are for, and the sequence below is roughly what to expect.
Questions about diet, alcohol, medications, periods, recent illness, bleeding and family origin
Ferritin if the cells are small, and B12, folate, liver and thyroid tests if they are large
Both sets when RDW is high but MCV is normal, since that pattern suggests a mixed picture
A repeat count in a few weeks when you feel well and the abnormality is modest
A blood film when the numbers do not fit together
Referral when the picture stays unexplained, particularly in older adults or when platelets and white cells are also abnormal
No supplements before the blood tests, because taking iron or B12 first blurs the results your doctor needs
Certain symptoms change the urgency entirely. Breathlessness at rest, chest pain, fainting, black or bloody stools, vomiting blood, flooding periods, unexplained weight loss, or new numbness and unsteadiness all deserve prompt medical attention, and the first few belong in an emergency department rather than a routine appointment.
Questions Worth Taking To The Appointment
Is my haemoglobin normal, or am I actually anaemic
What was my MCV, since RDW means little without it
Was ferritin checked, and what was the actual number
Does this pattern point towards iron, towards B12, or towards both
Given my family background, should thalassaemia trait be ruled out before I take iron
Could any medication I take explain this
When should this be repeated, and what would you expect to see
May I have a copy of the full blood count for my records
Keeping Red Cell Production On Steady Ground
Whatever your RDW turns out to reflect, the marrow behind it rebuilds your entire red cell supply several times a year, and it does that better when the raw materials arrive reliably and the background level of inflammation stays low. None of this replaces finding the cause of an abnormal result, and none of it should delay doing so.
Pair plant sources of iron with vitamin C, since beans with tomatoes or lentils with peppers noticeably improves absorption
Shift tea and coffee away from mealtimes, because compounds in both bind iron in the gut
Include haem iron from meat or fish if you eat them, as it is absorbed more readily than the plant form
Take vitamin B12 seriously on a vegan or largely plant-based diet, where fortified foods or a supplement are the reliable sources
Keep folate up with beans, leafy greens, citrus and fortified grains, and follow pregnancy advice on supplementation
Be honest about alcohol, which affects developing red cells directly and is a common explanation for abnormal indices
Raise heavy periods with a doctor instead of accepting them, since they are a leading and very treatable cause of iron loss
Treat ongoing inflammatory conditions properly, since chronic inflammation shows up in these numbers as well as in how you feel
Keep your own copies of blood counts, because the trend over several years carries far more information than one value
Go back for the repeat test you were told to have, since that second count is usually where the answer appears
Disclaimer
This article is general health information and is not medical advice. It cannot replace an assessment by a clinician who knows your history. Reference ranges vary between laboratories and analysers, and no single index should be interpreted without your haemoglobin, your other red cell values and your symptoms. Do not start, stop or change supplements or medication on the basis of one test result. Seek urgent care for chest pain, severe breathlessness, fainting or signs of significant bleeding.
References
Bessman JD, Gilmer PR Jr, Gardner FH. Improved classification of anemias by MCV and RDW. American Journal of Clinical Pathology. 1983;80(3):322-326. doi:10.1093/ajcp/80.3.322
Perlstein TS, Weuve J, Pfeffer MA, Beckman JA. Red blood cell distribution width and mortality risk in a community-based prospective cohort. Archives of Internal Medicine. 2009;169(6):588-594. doi:10.1001/archinternmed.2009.55
Patel KV, Ferrucci L, Ershler WB, Longo DL, Guralnik JM. Red blood cell distribution width and the risk of death in middle-aged and older adults. Archives of Internal Medicine. 2009;169(5):515-523. doi:10.1001/archinternmed.2009.11
The relationship between red cell distribution width and all-cause and cause-specific mortality in a general population. Scientific Reports. 2019;9:16019. doi:10.1038/s41598-019-52708-2
Felker GM, Allen LA, Pocock SJ, Shaw LK, McMurray JJV, Pfeffer MA, et al. Red cell distribution width as a novel prognostic marker in heart failure: data from the CHARM programme and the Duke Databank. Journal of the American College of Cardiology. 2007;50(1):40-47. doi:10.1016/j.jacc.2007.02.067
Van Vranken M. Evaluation of microcytosis. American Family Physician. 2010;82(9):1117-1122. PMID 21121557.
Kaferle J, Strzoda CE. Evaluation of macrocytosis. American Family Physician. 2009;79(3):203-208. PMID 19202968.
National Institutes of Health Office of Dietary Supplements. Iron: fact sheet for health professionals. Bethesda, MD: NIH ODS.
National Health Service. Vitamin B12 or folate deficiency anaemia. NHS health information.
US National Library of Medicine. RBC indices. MedlinePlus Medical Encyclopedia, article 003648.
About Dr. Thomas W. Longley, MD Physician
Dr. Thomas W. Longley provides thoughtful family medicine with a practical approach to everyday health concerns and ongoing patient care.






 Cardiologist